

Market basket analysis in e-commerce business explained (A Case study)

Market basket analysis is the most important topic for every online or offline retail business. Let us begin by understanding the basics of market basket analysis.
What is market basket analysis?
Market basket analysis is a modeling method used to identify the products purchased together. In other words, if a customer buys a product, what is the probability that he/she will buy another product along. Market Basket analysis also called Affinity Analysis.
The objective of market basket analysis is to increase sales by identifying the products bought together by customers. Based on this data or prediction a recommendation can be displayed on the e-commerce website.
Before we move on to the association rules and measures of market basket analysis, let us understand the recommender system. It will give you a complete picture of the market basket analysis concept and objective.
Recommender System
The recommender system primarily collects the data of customers purchasing behavior and predicts the possibility of products bought together. Based on the prediction of a buyer's preferences, it recommends a list of products that the customer is more likely to buy. Amazon, Netflix are great examples of recommender system usage.
Types of Recommender System
1. Knowledge-based Recommendations
The knowledge base system primarily predicts based on the products bought together. Examples, retail stores, or supermarkets.
2. Collaborative Filtering Models
Collaborative Filtering uses the data collected based on the buyer's preferences and recommends products to a similar type of buyer. For example, Online stores
3. Content-based Recommendations
The content-based support system predicts based on the historical purchase data of customers. For example, Movies, News, etc.
Association Rules
There are multiple methods to analyze the relationships between products. Association rules are the techniques that help to study the connection between products in common. The result of these methods is the set of rules to describe if this, then that.
Type of Association
1. Useful – Example, On Saturday, Hyper city customers purchase diapers and beer together.
2. Trivial – Example, Croma customers who purchase maintenance contracts also purchase large appliances.
3. Inexplicable – Example, when a new home depot store opens in an area, the most commonly sold items are toilet rings.
Three Important Measures
To understand the Market basket analysis measures better we have used the below case.
Assume 100 Customers visit a store
10 of them bought bread
8 of them bought butter, and
6 bought both bread and butter
Bought bread=> bought butter
Support = P(Buy both Bread & Butter) = 6/100 = 0.06
Confidence = P(Buy both Bread & Butter)/P(Buy Bread) = 0.06/0.08 = 0.75
- This is a conditional probability, what is the probability that the customer who has bought bread will also buy Butter
Lift = Confidence/P(Buy Bread) = 0.75/0.1 = 7.5
The customers who bought bread are 7.5% likely to buy butter as well. Lift is the measure that helps to improve the performance
Why is Market Basket Analysis Important for e-commerce Business?
Market Basket Analysis helps to increase sales by recommending appropriate products to the customers who are likely to buy. It improves the store credibility and user experience by providing specific recommendations. Also, reduces the time spent by the customers on product search.
The objective of market basket analysis is to increase sales by identifying the products bought together by customers.
Market Basket Analysis with R
Click here to Download Market Basket Analysis R code (R Document)
In the given Groceries DataSet, we have 9835 transactions. Each line contains a list of products bought together by customers. Our objective is to do the market basket analysis to find actionable and meaningful patterns or associations with the purchasing of products by consumers. This knowledge could be leveraged in-store layout and boosting sales and online (e-commerce store) product recommendations. To do the market basket analysis for the given data set we are following the below steps,
1. Exploratory data analysis
2. Market basket analysis using R
3. Displaying the result to Analyse the insight
4. Conclusion
Exploratory data analysis
There are 9835 transaction line items with 169 columns. Transactions as item Matrix in sparse format with 9835 rows (elements/item sets/transactions) and 169 columns (items) and a density of 0.02609146.
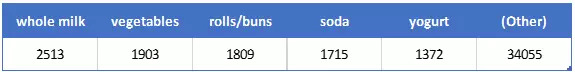
Most frequently purchased products list
Summary of Groceries data set
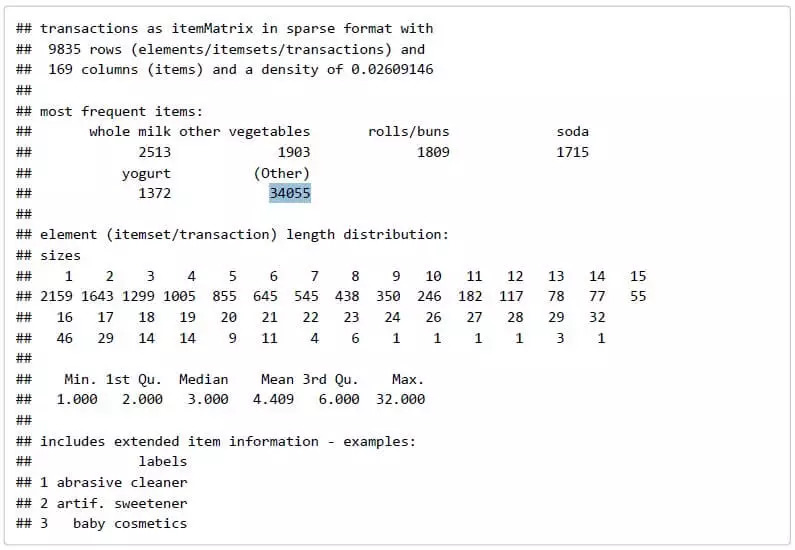
Density is the total number of none empty cells in the product data, in other words, the total number of products bought divided by the total number of possible products in the provided data.
In the most frequently purchased items, we can see that the whole milk is the most purchased in 2513 transactions. The second most purchased item is Vegetables 1903. If you add all these items, we get the total number of purchased items in the given dataset, which is 43,367 total items.
Elements section represents the size of the transactions, there are 2159 transactions that have only one item and 1643 transactions have only two items so on. There is only one transaction with 32 items and it occurred only once.
From the five-number summary stats, we can understand that the minimum transaction product is one and max is 32 with a median of 3 items per transaction. Also, it is a right-skewed distribution data. In the 2nd and 3rd quartile, we can interpret that 50% of the transactions have 2 to 6 products, only 25% of transactions have over 6 products purchased.
Displaying frequently purchased products graph
Analyzing the items that are having a purchase frequency of 10%

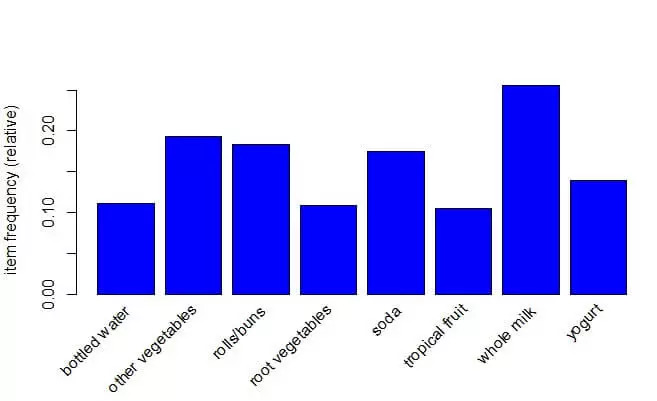
From the above graph, we can understand that these are the products having purchase frequency of 10% and above.

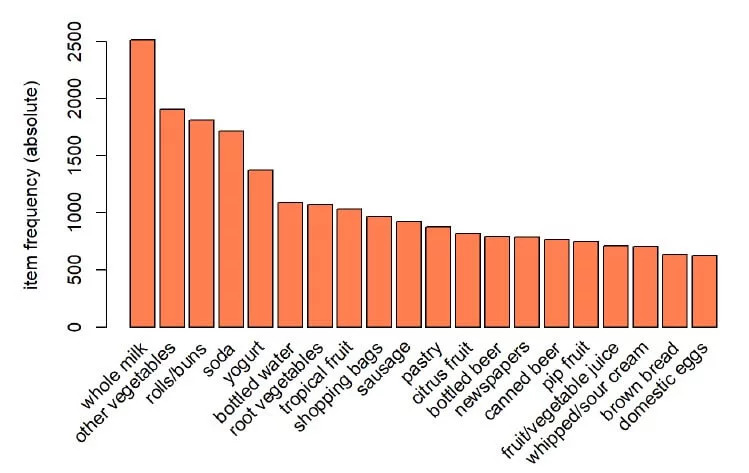
The above graph represents the top 20 frequently purchased products. This matrix will help in terms of product focus and layout. The top 5 products are Whole milk, Vegetables, Rolls/buns, Soda, and Yogurt.
Market basket analysis using R
In the rule setting section, we are determining the level of support and confidence we want for this basket analysis. So here, we are creating the basket with the Support level of 0.001, and the confidence level of 0.8. Here we are trying to build the baskets, which can significantly occur. This helps us to analyze the product's associate better.
Now let us interpret the rules output we have got for the given data set. Creating the rules to basket the products
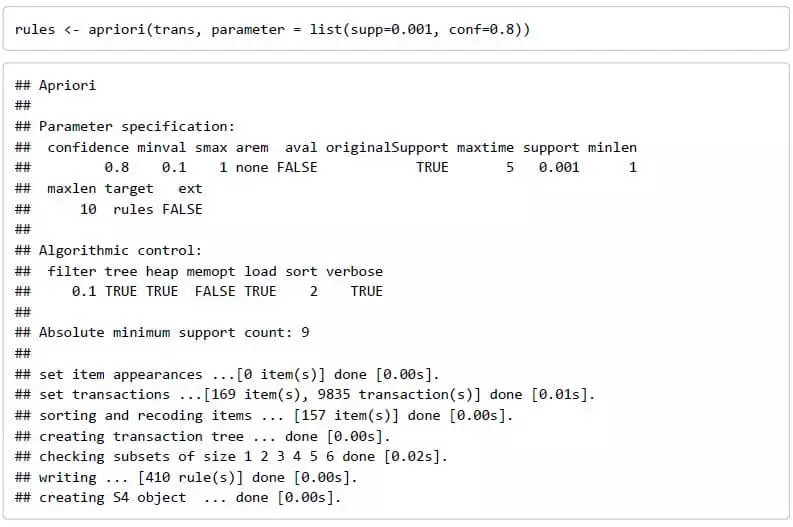
Displaying the result to analyze the insight
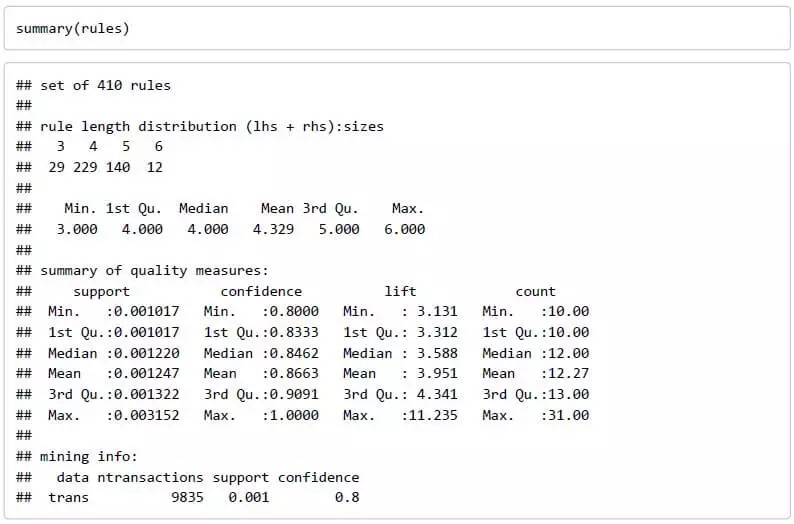
With the given support and confidence parameter we have 410 rules in order to create the baskets. From the summary, we can understand that there are 29 rules for 3 products, 229 rules for 4 products, 140 rules for 5 products and 12 rules for 6 products.
Now let us inspect the first few rules to study them. Below listed are 20 rules for references.
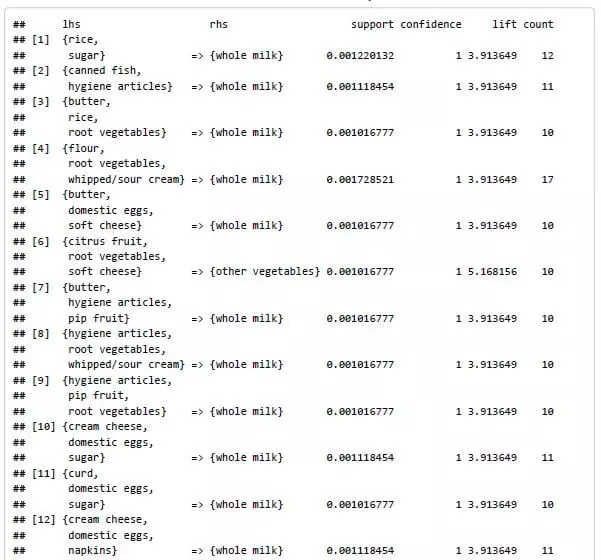
- The rule 1 reads, the consumer who have bought rice and sugar more likely to purchase whole milk, with the support level of 0.0012 and the confidence level of 1. This occurred 12 products in this data set. Lift is simply the confidence over the support of whole milk. So Higher lift is always better for product association, the higher lift is what needs more focus and action on.
- The better understanding of lift, in the first line the lift score indicates that whole milk is likely to be purchased almost 4 times higher along with rice & sugar compared with general purchase.
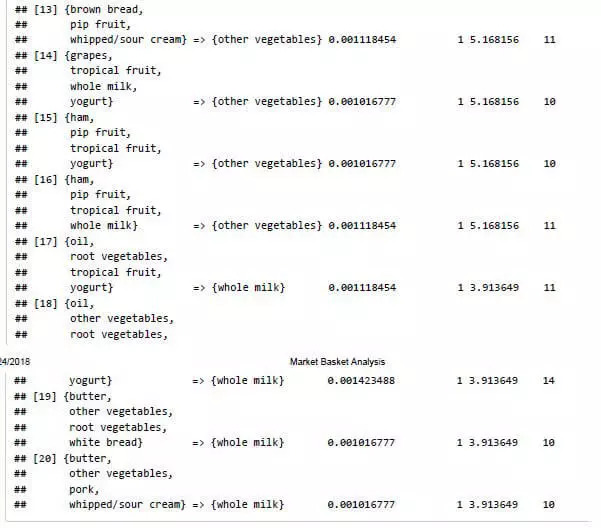
- Likewise, in the rule, 13 Brown bread, and pip fruit and whipped or sour cream purchased consumer will 5 times likely to by Vegetables with the confidence level of 1.
- Rule 13 to 16 are the 4 rules with the highest lift.
Now let us plot the 20 rules in a graph for better representation,

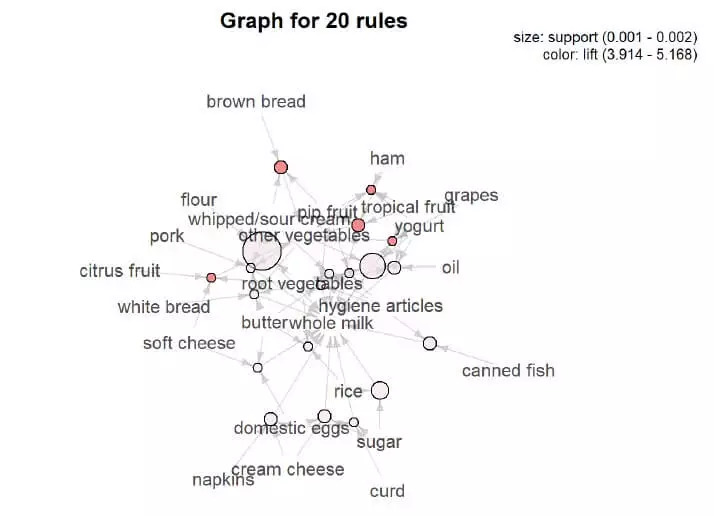
- This 20 rules products association graph helps to identify the associated products visually.
Conclusion
- We have identified the product association using market basket analysis. The top 20 rules will help the seller to determine their marketing strategy to promote sales.
- What we have identified by market basket analysis can be used to planning store layouts.
- “The concept of loss leader” are the products most frequently purchased and relatively low-value items which will attract the consumer to walk into the store. Once the consumers are in, the market basket analysis will help to promote and boost sales.
Benefits of Market Basket Analysis
- Increase sales by providing best recommendations
- Most appropriate when several different products are being recommended to the same Buyer
- Improves user experience
- Bundles products that go together
- Helps to gain the efficiency of overall e-commerce store performance.
- Also useful in placing related products close-by in physical stores and displaying in the online store

Rajarajachozhan
Business Owner
An energetic entrepreneur with 12 years of corporate experience in the field of brokerage operations and functions. A Data Science Aspirant - Business Analytics and Business Intelligence postgraduate professional from a reputed B-School in India. His passion for Data Visualization, Web and social media Analytics helped him to become a learner, speaker, and writer in the space of SEO, Digital Marketing, and UI, UX designs.